Visualisation
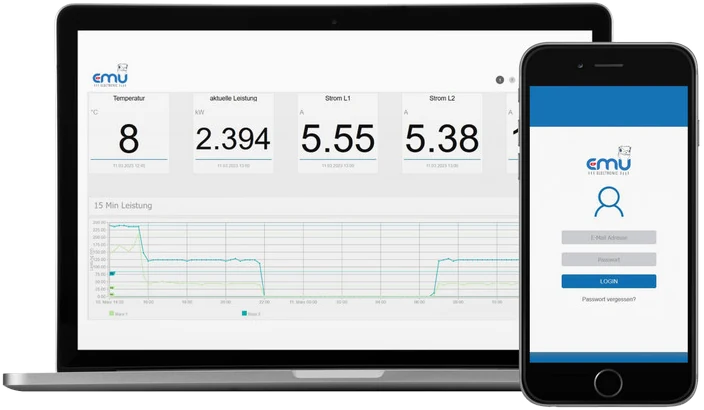
- Line, column and Sankey diagrams
- Load profile analysis
- Freely configurable charts with any measured values per chart
Further visualisations are in preparation.
Energy management · Made in Switzerland
Joulio-Web collects the data from your meters, analyses it automatically and produces the utility cost statement from it. Load peaks become visible before they show up on the next electricity bill.
ISO 50001
certified
Continuous data analysis, visualisation and reporting for certification. Eligible for BAFA funding in Germany.
SaaS
as a subscription, nothing to install
0
upper limit on meters and sites
4
ways to read data in
The measurement data comes from the EMU Professional II power meter and the EMU M-Center M-Bus data logger.
Functions
Further visualisations are in preparation.
Why energy management?
Not ISO 50001, but the utility cost statement. As soon as several parties in one building have to be billed, the manual route via Excel becomes the most expensive option – measured in working hours and follow-up questions.
Collecting data is easy by now. The effort has shifted to what comes after: drawing from a flood of quarter-hour values the two or three insights that actually change something. That is exactly what Joulio-Web is built for.
Line and column charts show trends. Sankey diagrams show something else: where the energy flows, in what quantity and through which intermediate stages. That is the representation that ends a discussion in a meeting fastest, because the proportions become visible instead of just the totals.
Load profile analysis reveals the quarter-hour values that determine demand charges. Freely configurable charts let you place any measured values side by side – consumption against outside temperature, production against electricity drawn, one rental unit against another.
An energy management system that needs checking every day stops being used after three months. That is why Joulio-Web works with scheduled and event-driven reports that arrive automatically by email, and with thresholds and tolerance bands that alert you when something goes outside the expected range. Normal operation creates no work; only deviations do.
Utility cost statements are produced straight from the meter data, for cost centres and individual flats alike. Where costs used to be allocated by floor area, billing is now based on actual consumption – which usually ends the arguments and reduces consumption along the way.
Data interfaces
Joulio-Web works with common meters from various manufacturers. The M-Bus part is handled by the EMU M-Center, which reads the meters and passes the values on.
Further interfaces are in preparation.
ISO 50001 and operation
The software is certified and delivers continuous data analysis, visualisation and reporting for certification.
Eligible for BAFA funding in Germany.
Software as a service in the browser, nothing to install. Unlimited number of measuring devices and sites.
Licences
Joulio-Web is now available only as software as a service (SaaS) on subscription; a purchased version for on-premises installation is no longer offered. You need the base subscription plus one licence per measuring device; charts are available as an add-on app. Contract term 12 months, notice period 3 months to the end of the calendar year.
| Joulio-Web SaaS, base subscription | 250.000.00 · unlimited number of sites |
|---|---|
| EMU and Helvatron meters | 250.000.01 · per meter |
| Third-party meters | 250.000.02 · per meter with a register reading, e.g. kWh or m³ |
| Sensor | 250.000.03 · e.g. LoRa sensors for temperature, humidity or light |
| Charts (add-on app) | 250.001.00 · requires the base subscription |
Data sheet and manual on emuag.ch
WEB Joulio-Web on emuag.chData sheet and manual as PDF, German and English
Project sequence

We look at what needs to be measured and why.
Site visit, analysis of the existing metering concept, workshop with the staff, new metering concept.
Software, meters and commissioning come from the manufacturer.
On-site training, system upkeep and ongoing support – charged by time spent.
Data flow
Two routes lead into the software, depending on what sits in the distribution board. Both have in common that the connection is set up by the device towards the outside and is encrypted.
The route taken by measured values from the EMU Professional II TCP/IP through an MQTT broker into Joulio-Web. Because the meter sets up the connection, the direction of the firewall rule stays outbound.
The EMU M-Center registers with a certificate and transmits the measured values to Joulio-Web over an encrypted channel. The connection is always set up by the device.
Frequently asked questions
Yes. Joulio-Web is ISO 50001 certified and delivers the continuous data analysis, visualisation and reporting needed for certification. In Germany the software is eligible for BAFA funding.
No. Joulio-Web runs as software as a service (SaaS) and is used in the browser, at the desk and on the smartphone. A purchased version for on-premises installation is no longer available.
The number of measuring devices and sites is not limited. The base subscription is complemented by one licence per measuring device: for EMU and Helvatron meters, third-party meters or sensors.
Common meters from any manufacturer over M-Bus via the EMU M-Center, over Modbus TCP and Modbus RTU, by CSV import over FTP or the web interface, and by manual data entry. Further interfaces are in preparation.
Only for M-Bus meters. Modbus TCP and Modbus RTU devices and CSV imports work without one. As soon as M-Bus is involved, the M-Center takes over the reading.
Tell us how many meters you have, who does the billing and whether ISO 50001 is a requirement. The licence follows from that – and so does the answer to whether it is worth it at all.
Phone
+41 (0)41 545 03 00
General
info@emuag.ch
Technical support
helpdesk@emuag.ch